
In Algebra, we just finished our unit on functions and a colleague of mine had been talking about Desmos, so I decided to explore it a bit and see what they had for functions. I discovered Function Carnival and thought it would be a perfect mini project for applications of functions. The activity has students watch three videos simulating different carnival activities (a cannon man, bumper cars, and a Ferris wheel) and then asks students to draw the scenarios as functions. After each scenario, the students are also prompted to help find errors in a provided graph and explain how to fix it. Before creating their own scenarios, I wanted to be sure students fully understood the situations they had been practicing on Desmos. I thought it might take some students more tries than others to get their graphs correct (and it did), so I also added to the project by asking students to redraw their graphs on graph paper after they completed the Desmos portion. With their hand drawn graphs, they then had to correctly label the independent and dependent axis with names and units, and then find several key features of the graph such as domain, range, y-intercept, and extremas. That way, the concepts were reinforced and they were able to analyze correct graphs before creating their own. (Below are student examples of graphs).

I am so happy with how this project turned out for several reasons:
- Every student was engaged in the Desmos activity. Giving students real world scenarios to physically see and digitally manipulate peaked students interest. The technology was easy for students to understand, but the scenarios were complex enough to capture their interest. Furthermore, students had the ability to self check their answers and when they weren’t exactly right, they wanted to go back and fix their mistakes to get the simulation to work precisely. It was tricky for some to understand why their path wasn’t matching, but I liked letting them have some time of productive struggle. They often called me over when they got their graphs perfect and wanted me to see their accuracy…I loved that!!
- Desmos incorporated a writing component for students to synthesize their learning. I really liked seeing how students interpreted the given scenarios and how they explained the errors that they were asked to correct. It gave students a chance to write in their own words about the mathematics of the situation. Telling students that I can also see this portion on my teacher view in Desmos perked them up to write in more complete sentences and will give me a chance to evaluate their grammar and mathematical vocabulary. Below are some examples:
- “The graph says that cannon man will have no suspension period in the air and that he will fall at the same speed going down without deploying his parachute. He should try adding a still period at the apex of cannons man jump and then making him fall fast. Afterwards he should slow him down before he hits the ground.”
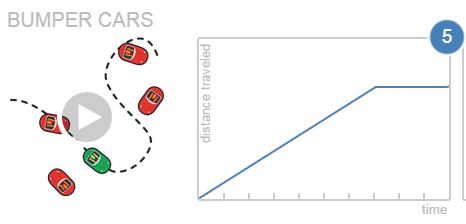
- “The bumper car would end up going backwards because its going back towards the start. she needs to make it into a straight line.”
- “The graph says the bumper car goes back in both time and distance. To help her, I tell her to measure how far along the road the car´s traveled, NOT draw the car´s path.”
- The additional portion I added required students to create their own units for the graph and reflect on what was happening in the scenario. When students had to create their own axis, they had to logically think about what would make sense…some started to write that their cannon only shot up to 5 or 6 feet tall…that wouldn’t make for a very fun carnival event!! After understanding this, they fixed it and were able to justify more appropriate units. They also realized without units, they could not accurately state their domain and range.
- Vocabulary from our unit was reinforced at several points throughout the project. Several students quickly noticed when they drew extra lines in the Desmos window it would make more cannon men or bumper cars appear…which was quite fun :)…but beyond that, they explained to me that it was no longer a function because their graphs did not pass the vertical line test and there were too many outputs for one input. We also talked about the slope of the lines when the cannon man’s parachute deployed, when the bumper car crashed and stopped, and when the Ferris wheel ride had a constant speed. It brought meaning to the lines and why they were less steep, flat, or constant.
- Lastly, I got to use this super cool half graph and half lined notebook I requested for our math department!! 🙂


I’m looking forward to more Desmos projects! If you’re interested in the additional pieces I added to the project, Desmos Carnival Project.

Thanks for these reflections here, Ashley. We love hearing how these lessons of our works in the field. It’s especially interesting (to me) that students did better written work when they understood that you’d be looking at. It makes me think we should let students know that explicitly, for all the teachers who don’t make that explicit like you did.
LikeLike
Thank you for reading! I will definitely be using Desmos activities (as well as Desmos in general) more often with students. Thanks for all you do in furthering mathematics education!
LikeLike